Visitors often arrive with a single mental model of India and find it failing within a week. The failure is not a matter of atmosphere or impression: the underlying indicators differ by margins that would separate distinct countries elsewhere, and the Indian government publishes all of them.
This guide sets out the measured contrasts. It uses Karnataka, Tamil Nadu, Kerala, Telangana and Andhra Pradesh against Uttar Pradesh, Bihar, Rajasthan and Madhya Pradesh, because those are the comparisons the data supports.
A note before the numbers
Telangana was created in 2014, so Census 2011 has no Telangana row — its territory sits inside undivided Andhra Pradesh in every 2011 table. Telangana appears only in post-2014 sources. Anyone comparing 2011 census figures to current state boundaries needs to hold that in mind.
Income
The Ministry of Statistics publishes per capita net state domestic product at current prices.
| State | 2023-24 | 2024-25 |
|---|---|---|
| Karnataka | Rs 346,736 | Rs 386,155 |
| Telangana | Rs 346,165 | Rs 380,031 |
| Tamil Nadu | Rs 313,329 | Rs 361,619 |
| Kerala | Rs 281,269 | Rs 308,338 |
| Andhra Pradesh | Rs 239,311 | Rs 266,698 |
| Rajasthan | Rs 167,026 | Rs 185,094 |
| Madhya Pradesh | Rs 141,756 | Rs 154,124 |
| Uttar Pradesh | Rs 98,047 | Rs 109,843 |
| Bihar | Rs 62,203 | Rs 69,210 |
Karnataka's 2024-25 figure is roughly 5.6 times Bihar's and 3.5 times Uttar Pradesh's. For context in the same series, Delhi was at Rs 457,708 in 2023-24 and Maharashtra at Rs 285,290.
Demography
Fertility is the indicator where the two blocks have diverged most visibly. The Sample Registration System's 2024 report gives total fertility rates:
Bihar 2.9, Uttar Pradesh 2.6, Madhya Pradesh 2.4, Rajasthan 2.3 — against Karnataka 1.5, Telangana 1.5, Andhra Pradesh 1.4, Kerala 1.3 and Tamil Nadu 1.3. The all-India figure is 1.9, down from 5.2 in 1971.
Every southern state on that list is below replacement level while every northern one on it is above the national average. That single split drives a great deal of what a traveller observes about age structure, household size and school enrolment.
Census 2011 literacy, computed from its published counts, runs Kerala 94.00 percent, Tamil Nadu 80.09, Karnataka 75.36 — against Bihar 61.80, Rajasthan 66.11, Uttar Pradesh 67.68. India as a whole was 72.98. Kerala's sex ratio of 1,084 females per 1,000 males was the highest of any state; Uttar Pradesh recorded 912.
Urbanisation splits the same way but less cleanly: Tamil Nadu 48.40 percent and Kerala 47.70 against Bihar 11.29 and Uttar Pradesh 22.27, with Karnataka at 38.67 and the national figure 31.14.
Language, which is a family difference and not a dialect one
The Census of India makes the linguistic classification itself, which means it can be stated as fact rather than as interpretation. Its 2011 language paper groups the 121 languages it counts by family.
| Family | Languages | Speakers | Share |
|---|---|---|---|
| Indo-Aryan | 21 | 945,052,555 | 78.05% |
| Dravidian | 17 | 237,840,116 | 19.64% |
| Tibeto-Burmese | 66 | 12,257,382 | 1.01% |
| Austro-Asiatic | 14 | 13,493,080 | 1.11% |
Of the 22 Scheduled languages, the Census states that 15 are Indo-Aryan, 4 are Dravidian — Kannada, Malayalam, Tamil and Telugu — one is Austro-Asiatic and two are Tibeto-Burmese.
By speakers, Hindi leads at 528,347,193 or 43.63 percent, followed by Bengali at 8.03, Marathi 6.86, Telugu 6.70, Tamil 5.70, Gujarati 4.58, Urdu 4.19, Kannada 3.61, Odia 3.10 and Malayalam 2.88.
The practical consequence for a visitor is that Hindi is not a fallback in Bengaluru the way it is in Jaipur, and the writing on shopfronts is not a variant of the Devanagari you may have started to recognise. It is a different script for a language in a different family.
Bengaluru specifically
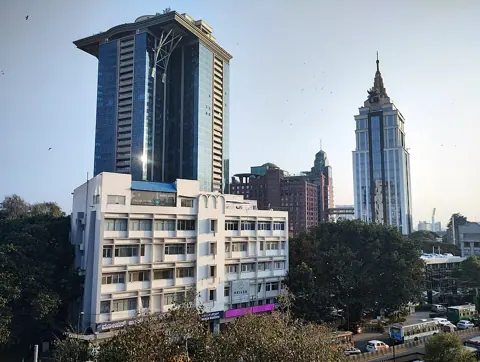
Census 2011 recorded the Bruhat Bangalore urban agglomeration at 8,520,435 people and the municipal corporation alone at 8,443,675. The technology and aerospace institutions behind that growth are largely closed to visitors.
Karnataka's official language rests on the Karnataka Official Language Act, 1963, Act No. 26 of 1963, enacted on 5 October 1963 and enforced on 10 October. Its section 2 reads: "Kannada to be the official language of the State.—The official language of the State of Karnataka shall be Kannada." Its statement of objects records that it was made in pursuance of Article 345 of the Constitution, and section 3 preserves English for official purposes until the government directs otherwise. A later statute, the Kannada Language Comprehensive Development Act, 2022, was enacted on 10 March 2023.
Climate, which travellers get wrong more than anything else
India Meteorological Department normals for the two cities differ enough to change what you pack.
| Bengaluru | Delhi | |
|---|---|---|
| Warmest monthly mean maximum | 33.8 °C (April) | 40.3 °C (May) |
| Coolest monthly mean maximum | 26.2 °C (December) | 20.4 °C (January) |
| Annual spread in mean maximum | 7.6 °C | 19.9 °C |
| Coldest monthly mean minimum | 14.8 °C (January) | 7.3 °C (January) |
| Wettest month | September, 183.5 mm | August, 188.7 mm |
| October rainfall | 155.9 mm | 13.7 mm |
Bengaluru's annual rainfall totals roughly 874.6 mm against Delhi's 674.6 mm on these normals, but the distribution matters more than the total, as the northern heat and monsoon calendar shows from the other end. Bengaluru's October is wetter than its July. Delhi's October is effectively dry.
What this guide does not cover
No official source was found stating that southern states use distinct scripts, so that is asserted here only from the fact of separate language families, not from a script claim. The Census classifies by family and never by script.
The averaging period for the Bengaluru and Delhi temperature normals is not stated by IMD on the page that publishes them, so no period is given above. The rainfall normals IMD publishes by district are separately labelled 1971 to 2020.
No IMD normal monsoon onset date is given for Delhi or Bengaluru individually. IMD publishes city-level onset only as map isochrones without city markers.
The Census 2011 literacy, sex ratio and urbanisation percentages above were computed from published counts, because the full state-wise rate tables are published only as chart images.
The per capita state product figures come from the Ministry's live data service, which returns them without a citation to a named, dated release.
Census 2011 is fifteen years old. The next census is notified for 2027.